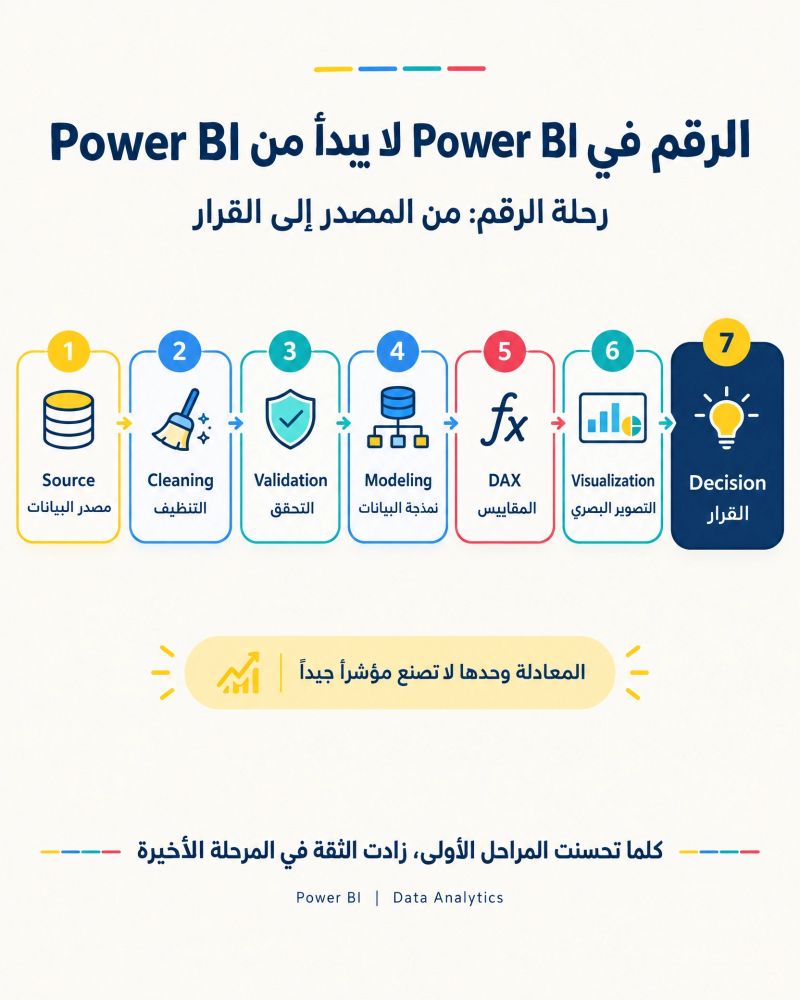

The number displayed on a Power BI dashboard does not originate in Power BI itself.
Behind every number shown on a dashboard lies an end-to-end data journey that begins long before visualization. This journey passes through several stages, each of which directly affects the quality and reliability of the final result.
The journey begins with the data source (Source), where the first important question arises:
Is the data coming from the correct and authoritative source?
Even the most advanced analytical processes cannot produce reliable results if the data comes from an unapproved or outdated source.
Next comes data cleaning (Cleaning), where common issues are addressed, including duplicate records, inconsistent values, missing fields, and incompatible formats.
However, having and cleaning the data does not necessarily mean that it is ready for use.
This is where data validation (Validation) becomes essential. Validation confirms that values comply with business rules and approved indicator definitions. A value may be technically present but still fail to represent the concept being measured accurately.
The next stage is data modeling (Data Modeling), in which tables are organized and relationships are established correctly. This ensures that analyses and calculations operate within a clear and connected model.
Measures and calculations are then developed using DAX.
At this stage, an important principle must be recognized:
A technically correct formula does not necessarily produce a valid indicator.
A DAX formula may be written perfectly, but if the indicator definition is unclear or the underlying data is unreliable, the final result will still require review.
Next comes data visualization (Visualization).
The objective is not to increase the number of charts and visuals on the dashboard. It is to select the format that helps users understand the question and reach the answer more quickly and clearly.
The journey ultimately reaches its most important destination:
The decision (Decision).
The true purpose of a dashboard is not merely to display numbers, but to transform data into clear and reliable information that helps users understand reality and supports decision-making.
This journey can be summarized as follows:
Source → Cleaning → Validation → Modeling → DAX → Visualization → Decision
The higher the quality of the early stages, the greater the confidence in the final outcome.
A successful dashboard therefore does not begin with selecting a visual or writing a DAX formula. It begins with the quality and source of the data and the definitions of the indicators built upon it.
To view the original post and learn more on LinkedIn:
https://lnkd.in/p/d-dAidM6
Source: A LinkedIn post by Mr. Abdulkhaleq Alshadidi.